Welcome to my portfolio! I am ecstatic that you are taking the time to look through.
A little bit about me starting from the beginning, I obtained a B.Tech with Honours from Ryerson University. My first position out of school was in project planning for a production manufacturing facility. From there, I decided that I wanted to join the fast-paced world of technology and started in Product Support at a software company that produces information systems for the manufacturing sector. I quickly learned the ropes and became a Customer Experience Specialist, with a portfolio of dedicated clients.
Since then, I have decided to do a deeper dive into the technology sector and have completed a Bootcamp at the University of Toronto in Data Analytics and Visualization. This was an extensive Bootcamp, where I have obtained numerous skills including Excel, VBA, Python, JavaScript, and SQL. I am also curious and critical, always asking why and how something can be improved, traits that are very well suited for data analytics.
In addition to hard skills, I have excellent interpersonal skills honed through years of working with clients. I believe that my combination of technical skills and emotional intelligence makes me a valuable addition to any team. If you are looking for an addition to your data team, and we are not already in contact please reach out. I’d be happy to chat! Until then, please feel free to explore the rest of my portfolio.
SEPTEMBER 2018 - JANUARY 2020
• Maintained a 100% client satisfaction rate by proactively managing customer expectations and relationships internally (development, testing) to ensure the best outcomes.
• Managed portfolio of 17 clients by demoing software, educating about new features and aiding in the creation of efficient workflows within the software.
• Utilizes a fantastic personality and excellent communication skills to advocate for customers internally during the prioritization of new features and resolution of defects.
• Onboarded 3 new employees on internal processes and correct utilization of the software.
Key Accomplishments:
• Selected to represent the department in the Avanti User Group Conference 2019 in Nashville.
APRIL 2018 - SEPTEMBER 2018
• Take ownership of the support request life cycle by setting up support process from end-to-end, by collaborating with internal development, quality assurance, and implementation teams to drive tickets to closure.
• Excellent in technical and functional problem-solving skills with a keen business sense by providing a rapid response and resolution to complex product issues.
• Reproducing and meticulously documenting software defects, making recommendations for product enhancements where appropriate as part of the incident/problem management process.
MAY 2016 - APRIL 2018
• Plan, cost, and oversee up to 6 new projects at one time and ensure assigned team has all necessary information to implement projects.
• Conduct job planning meetings to ensure the team understands deadlines, budget, and the customer’s quality standards. Facilitate decision making based on customer’s end goal to ensure efficient use of time, materials, and equipment.
• Write standard operating procedures for new customers to document success through trial and error.
Key Accomplishments:
• Participated in CCL’s Rotational Graduate Program to learn all aspects of the business.
SEPTEMBER 2019 - MARCH 2020
An intensive 24-week long bootcamp. Analytics with data from CSVs, API interactions, Web Scraping, and Google API using VBA, Python, SLQ, Javascript, R, and HTML/CSS.
SKILLS LEARNED:
• Data Manipulation & Visualization: Pandas, Matplotlib, Leaflet.js, Tableau
• Machine Learning: Hadoop, tensorflow
• Database: SQL (PostgreSQL), NoSQL (MongoDB)
• Other: Git, Google Analytics, Flask, command line
• Agile software development methodology, ZenDesk and Atlassian
SEPTEMBER 2012 - APRIL 2016
B.Tech in Graphic Communications Management
• Minored in Human Resource Management, Took electives in Geography.
• Achieved Ryerson Student Scholar Status and Dean’s List on all years of Studies
• Awarded numerious awards and scholarships including the prestigious Dennis Mock Leadership Award, for outstanding voluntary extracurricular contributions to my academic program department.
2015 - 2016
Courses include:
- Foundations of Business Strategy
- Advanced Business Strategy
- Business Growth Strategy
- Strategic Planning and Execution
- Business Strategy in Practice
See my certificate here
2015
Courses include:
- Initiating and Planning Projects
- Budgeting and Scheduling Projects
- Managing Project Risks and Changes
- Project Management
See my certificate here
My passion and goal is to help your company make educated business decisions through data presented in a meaningful and personable approach.
Data is nothing without a meaningful presentation both visually and verbally. I have an eye for design and excellent communication skills honed through years of building client relationships.
Skilled in the top coding language for data analytics. Libraries in my toolkit include Pandas, Numpy, and Matplotlibs.
The ability to mine hidden gems located within large sets of structured, semi-structured, and raw data also requires knowledge of where and how to store and retrieve it.
These tools are not just for creating beautiful websites. I have the know-how to use these tools for web scraping data and creating elegant custom dashboards to summarize the data.
Experienced in industry-standard BI tools like Tableau to go from raw data to impressive presentation-ready visualizations quickly.
Anything but basic with Excel for smaller datasets. Deep understanding of pivot tables and VBA scripts to automate spreadsheets and data entry.
Here are some of the selected projects I have done lately. Feel free to take a look.
JavaScript with Plotly.js
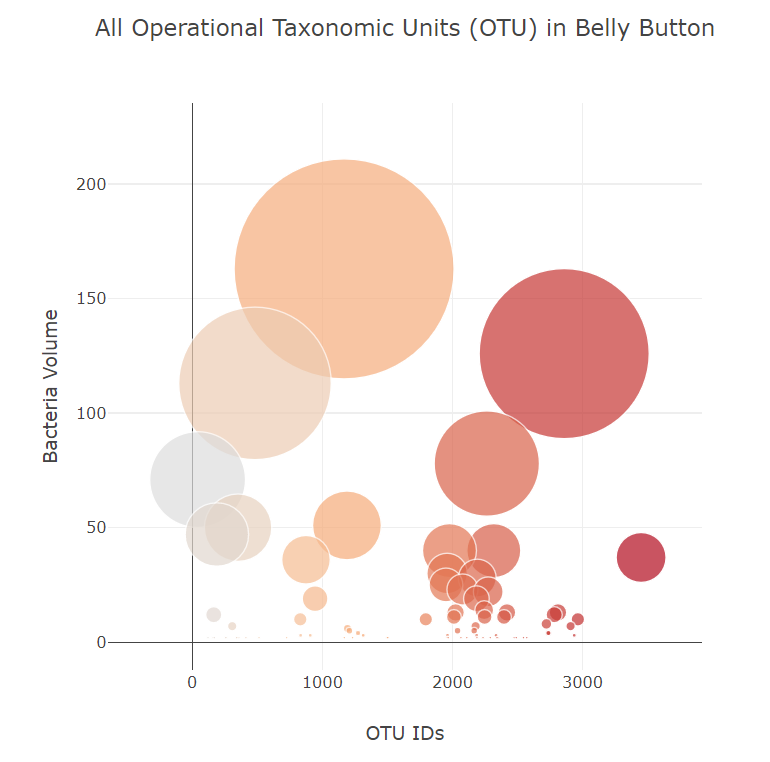
Built an interactive dashboard to explore the Belly Button Biodiversity dataset, which catalogs the microbes that colonize human navels.
JavaScript with Plotly.js
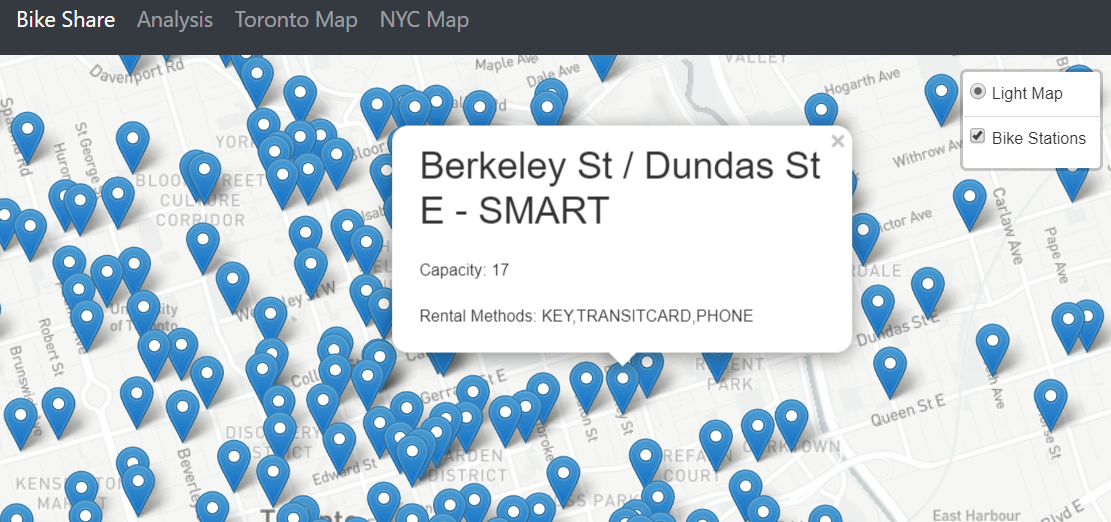
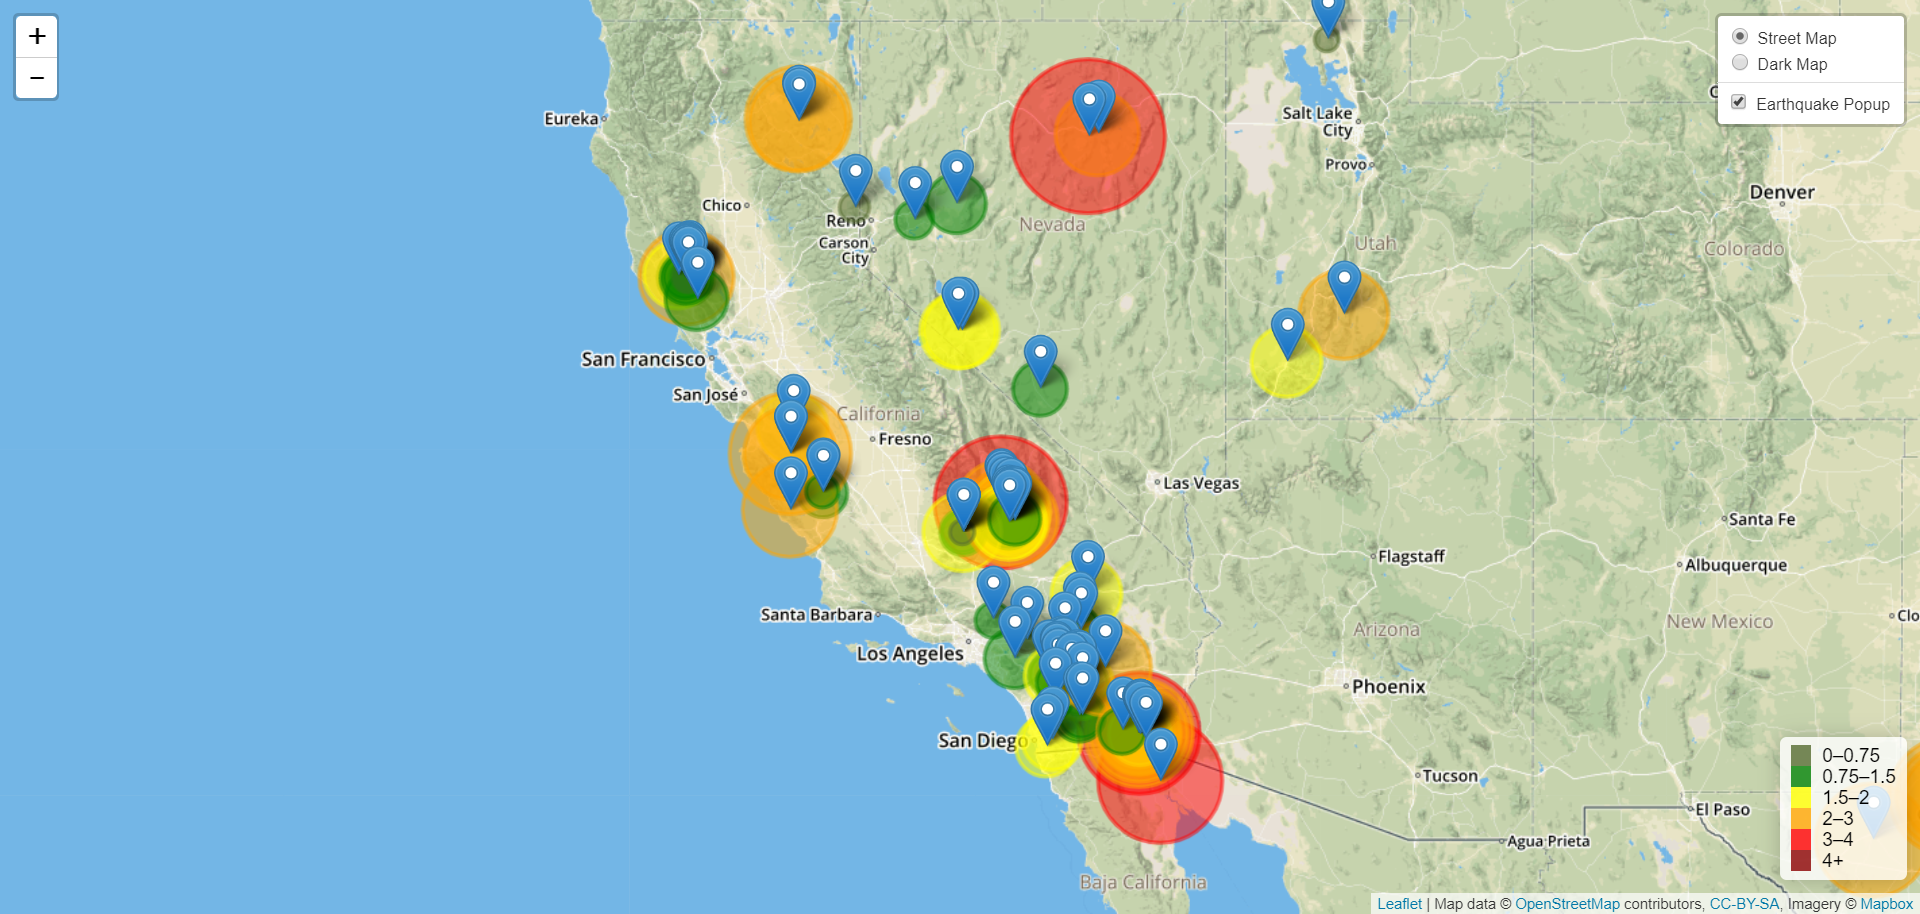
Built a site to plot the earthquakes in the USA. The data was taken from the Earthquake Hazards Program, and shows all earthquakes within 24 hours. This geoJSON dataset is updated every minute, therefore the map provides real time updates.
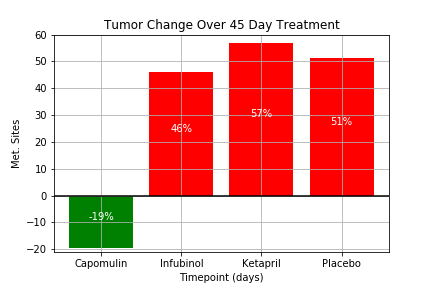
Python and Matplotlib
In this study, 250 mice were treated through a variety of drug regimes over the course of 45 days. Their physiological responses were then monitored over the course of that time. The objective is to analyze the data to show how four treatments (Capomulin, Infubinol, Ketapril, and Placebo) compare.
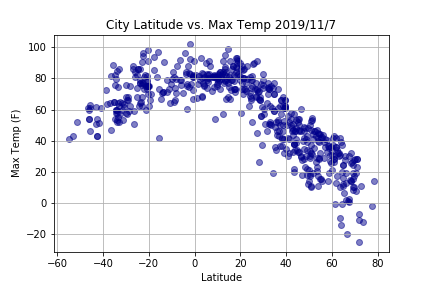
Python with Pandas and Matplotlibs
This repository uses the Open Weather Map API, and JSON traversals to answer a fundamental question: "What's the weather like as we approach the equator?"
I'm happy to connect. Let's work together and build something awesome. Email Me.